In summer 2021, the office market was gearing up for a much-anticipated return to the office in the fall as a result of widespread optimism owing to efficient COVID-19 vaccine rollouts and falling case counts. However, the emergence and subsequent ascent of the delta and omicron variants threw a wrench in return-to-office scenarios as companies put their plans on hold until the latest wave of infections subsides. Even firms highly intent on returning to the office, such as Goldman Sachs, have tightened their safety measures, while others — including Apple and Google parent company Alphabet — have delayed their early 2022 plans.
While the timeline of an eventual return to the office is fluid, what has become apparent so far is the transformation of the traditional office space utilization and workers’ preferences. According to CBRE’s Workforce Sentiment Survey, 85% of participants stated that they would like to carry out their job-related activities remotely at least two to three days a week. And based on CBRE’s Occupier Sentiment Survey, 87% of firms that responded revealed plans to adopt some form of hybrid work program.
Average asking rates in top U.S. markets improve by 1.8% Year-over-Year
According to a recent report released by CommercialEdge, the average full-service equivalent listing rate for office space across the top 50 U.S. markets improved by 1.8% year-over-year, clocking in at $38.44 per square foot in December.
On a metro level, Phoenix was among the markets with the highest rent growth, with the average asking rate up 9.5% year-over-year. As of December, Phoenix office space averaged $30.01 per square foot. The full-service equivalent listing rate in Atlanta was also on an upward trajectory, increasing by 8.1% and amounting to $29.21 per square foot. Meanwhile, asking rates in Tampa rose by 7.9% and reached $30.90 per square foot in December.
On the other end of the spectrum, markets that experienced tempered rent growth included Chicago, where the average asking rate for office space inched up by 0.9% year-over-year, to $28.19 per square foot. At the same time, the average office rent in Washington, D.C., also saw a moderate uptick — rents edged up by 1.4%, clocking in at $41.78 per square foot as of December.
U.S. vacancy rates stall in the second half of 2021
The national office vacancy rate averaged 15.5% across the top 50 markets in December, edging up by 130 basis points year-over-year. While vacancy rates spiked in most markets in the first six months of 2021, overall levels stabilized in the second half of the year.
In an individual market analysis, strong absorption volumes pushed the average vacancy rate in Boston to 10.3% in December, making the metro the tightest market in terms of vacancy among the top 50 U.S. markets. Following closely behind and below the national average as well, the vacancy rate for Miami office space rested at 12.5%, while all the way on the West Coast, Los Angeles was also a strong performer, registering a 13.2% vacancy rate.
Office development pipeline exceeds 156 million square feet
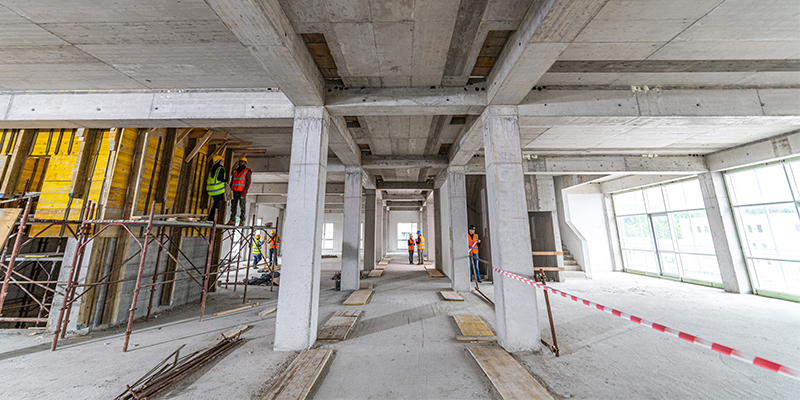
As of December, 156.6 million square feet of office space was under construction across the top 50 markets. With nearly half of the pipeline clustered in urban submarkets, 30.3% in suburban areas and the remaining 21.1% in central business districts (CBD), development patterns are still displaying pre-pandemic trends.
Nevertheless, the planned pipeline is indicative of quite a different trend. While 35% of planned developments were in suburban submarkets in early 2020, the total share of planned projects in the suburbs rose notably in 2021, closing the year at 48%.
On a local level, Austin led the nation in development as of December, with a robust construction pipeline accounting for 10.6% of existing stock. Nashville office space was not far behind, with the metro’s pipeline taking up 8% of total stock. The third-highest share of office projects underway was in Brooklyn, where under-construction office space equaled 5.2% of existing inventory.
CBD sales prices lag in 2021, trail urban submarket trends
Total office transaction volume in the top 50 markets amounted to $77 billion at the close of 2021, with the average sale price climbing to $293 per square foot.
Although prices for office properties in submarkets ranked as CBD and urban had a similar trajectory in the wake of the Great Financial Crisis, the pandemic sparked a distinct trend. While average office sales prices in urban areas — defined as within the city center but outside of the CBD — maintained the same pace they had over the previous decade, CBD prices have slipped since the onset of the pandemic. Consequently, sales prices for office properties in urban submarkets increased by 28% over the last two years, while the average CBD sales price fell by 19% over the same interval, to $323 per square foot as of December.
Download and read the full report from CommercialEdge on December 2021 office lease rates, construction and sales here.

