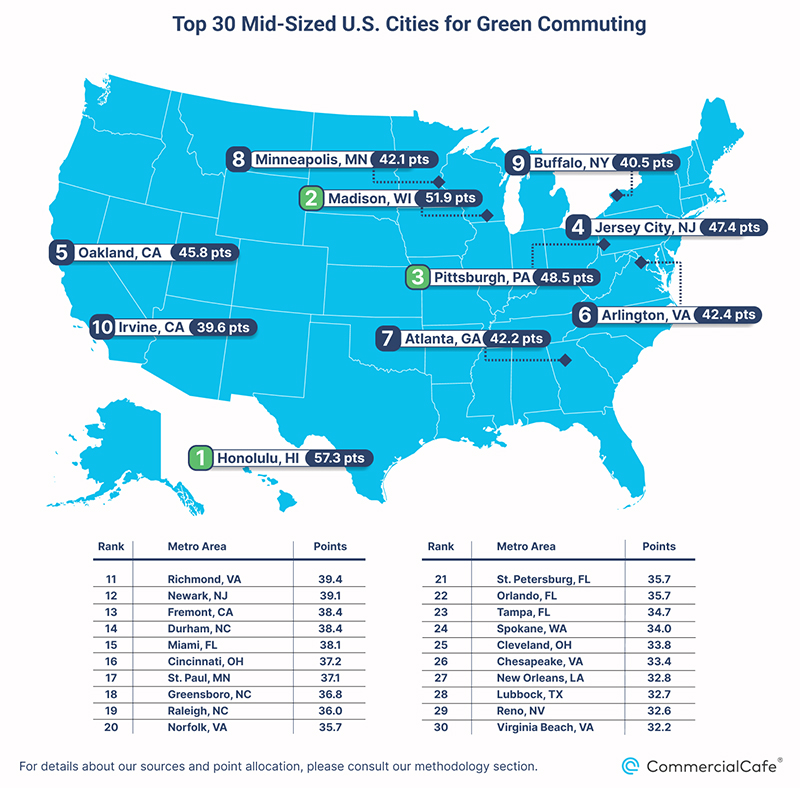
With many returning to offices, sustainable commuting options are back in the spotlight. With this in mind, a recent study from CommercialCafe explored which mid-sized U.S. cities (populations between 220,000 and 500,000) are leading the way in offering eco-friendly commutes. By focusing on this specific size range, the analysis provides insights beyond major metropolises and allows for more fair comparisons of green commuting practices.
To order to identify the leaders in green commuting, the study analyzed several key factors including public transportation ridership, walking and cycling rates, carpooling engagement, access to EV charging stations, and the promotion of pedestrian and cycling commuting with green amenities and attractive urban environments.
Read on to discover the top 30 cities and gain insights into the best performing examples of sustainable commuting in action.

Honolulu Leads the Pack in Sustainable Commuting
Honolulu was the standout city in green commuting, consistently ranking high across key categories: carpooling, cycling and walking This reflects the city’s efforts in facilitating residents’ access to various eco-friendly commuting methods, including carpooling, public transportation, cycling and walking. Specifically, with 21% of commuting drivers choosing to carpool, Honolulu had the highest carpool score among the top 30 cities. The Island Capital’s performance also secured second place for both walking (8.5%) and cycling (2.5%) commute rates.
While Honolulu reigned supreme overall, other cities excel in specific areas: New Jersey’s Jersey City and Newark, with their proximity to New York City, claimed the top spots for public transit usage. The study revealed that 36% of Jersey City commuters and 20% of Newark commuters rely on buses, trains or subways for their daily commute. Arlington, Virgina, (12%) and Oakland, California, (11%) also deserve recognition for their high public transit ridership, likely facilitated by their closeness to major metropolitan areas with strong public transportation networks.
Meanwhile, Pittsburgh emerged as the walking leader, with 11% of its workforce choosing this healthy option for their daily commute. While Madison took the crown for cycling, with 2.2% of its residents opting for this eco-friendly and active mode of transportation.
California’s Electric Avenue: Irvine Leads Mid-Sized Cities in Charging Network Density
While carpooling helps mitigate car dependency, electric vehicles (EVs) offer a more substantial leap towards sustainable transportation. Mid-sized cities are embracing this shift, with Irvine, California, leading the charge. Boasting the highest density of EV charging stations among the top 30 cities (20 stations per 10,000 residents), Irvine’s position is perhaps unsurprising considering its proximity to Los Angeles, the nation’s leader in EV ownership among major metro areas.
However, the EV movement extends beyond the Golden State, gaining traction nationwide. Atlanta, for instance, secured the second-highest ranking in charging stations per capita, highlighting the national trend. With growing support from federal initiatives, we can expect an upward trajectory for both EV adoption and supporting infrastructure across mid-sized U.S. cities.
Top U.S. Mid-Sized Cities by Density of Green Spaces
Parks and green spaces go beyond aesthetics, offering environmental benefits, enhancing city health, and even encouraging alternative transportation. To explore this connection, the study evaluated three key factors: park density per capita, park area as a percentage of total city size, and tree canopy cover.
Greensboro, North Carolina, emerged as the park leader with over 500 parks, translating to 18 parks per 10,000 residents. This abundance puts it significantly ahead of competitors like Madison, Wisconsin, which comes in second with 11 parks per 10,000 residents – a noteworthy advantage considering Madison’s high rate of bike and walk commuters.
Shifting coasts, Fremont, California, claimed the top spot for the highest percentage of park area compared to its total size. From its 450-acre Central Park to over 50 additional community parks, Fremont dedicates 44% of its total land area to green spaces.
North Carolina shined again, this time for tree canopy cover. Two Carolina Triangle cities, Durham and Raleigh, took the top two positions, boasting over half of their respective city areas as shaded by tree canopy – Durham at 52% and Raleigh at 50%. Atlanta followed closely behind with 46% coverage.
Here’s a full breakdown of both values and points scored for each for the 10 metrics.
For more highlights, as well as a breakdown of the methodology, read the full report on CommercialCafe.com.


