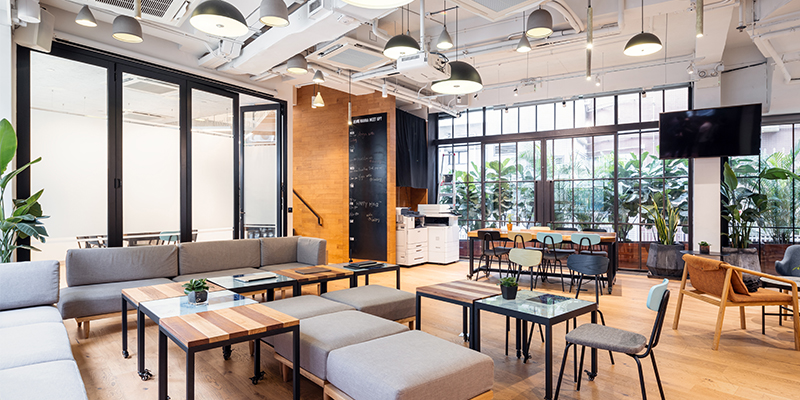
While the past two years have been marked by considerable speculation around the future of office-based and remote work, there is no uncertainty around the fact that companies will still need physical spaces for training, collaboration and culture building. Considering the changing nature of these activities, a trend has been gaining ground to keep up with demands: flex space.
Earlier this year, a CBRE study revealed that 86% of the 77 global companies surveyed will include flex space as part of their real estate strategies going forward. This adaptable solution is not only filling in the gaps of the present but will likely play an essential role in offering employee flexibility and amenities in a tight labor market. However, according to CommercialEdge, only 5.6% of office buildings have flex space within their properties thus far, while 30% of buildings with flex space are clustered in five markets: Manhattan, New York; Los Angeles; Washington, D.C.; Dallas and Boston. As such, owners and landlords will have to adapt to this growing tenant demand to maintain leasing rates.
National average office rent posts 1.2% year-over-year rise
According to a recent report released by CommercialEdge, full-service equivalent listing rates averaged $38.62 in November, up 1.2% year-over-year. Across the top 50 U.S. markets, average office rents ranged from $22.13 per square foot in Orlando, Florida, to $83.52 per square foot in Manhattan, New York.
Office rates rose fastest in Los Angeles, increasing by 8.1% year-over-year and reaching a $41.62 average. The San Francisco Bay Area ($55.79/sq. ft.) and Tampa, Florida, ($29.70/sq. ft.) followed, with leasing rates rising by 6.2% in both. Miami ($43.43/sq. ft.) saw the third-highest increase in office rents, which went up by 5.8% since the same period last year.
Vacancies remain stable across U.S. office markets
Vacancies remained steady through November – the national average vacancy rate was 15.2%, edging up by 140 basis points (bps) in the past 12 months but decreasing by 40 bps in the past six. This shift has solidified across U.S. office markets, as vacancies soared compared to 2020 but then began cooling in the second half of this year.
Austin, Texas, and Seattle are two of the most revealing examples in this trend. The average vacancy rate in Austin rose by 600 bps compared to last year, resting at 17.3% in November. However, vacancies inched up by only 60 bps in the past six months, as the surge occurred not only due to the pandemic, but also because a significant amount of office stock came online in the market. A considerable 7.7.% of the total office space in Austin has been delivered since the start of 2020.
Seattle shared a similar trajectory, with vacancies rising by 630 bps in the past year but only by 70 bps since May. The impact of new office supply played a less significant but still crucial role in the Washington market, as 4% of Seattle office space came online in the past two years.
Total sales volume nears $70 billion by end of November
Year-to-date, $68.8 billion of office transactions were completed on a national level, already 11% higher than last year. Notably, sales for Seattle office space crossed the $4 billion threshold, reaching a volume of $4.3 billion. Meanwhile, Chicago ($1.1 billion), Phoenix ($1.9 billion) and Charlotte, North Carolina, ($1.3 billion) were the latest markets to surpass $1 billion in office transactions.
Prices reflect the rise in investor interest, growing steadily throughout this year. As buyer confidence in high-quality assets counterbalanced doubts prompted by the pandemic, the average sale price rose to an all-time high of $291 per square foot this November.
National supply pipeline contracts to 152 million square feet
With construction for new projects advancing at a slower pace than delivery rates, the supply pipeline has shrunk to 2.3% of the total office stock on a national level. As of November, 152.8 million square feet of new office space was under construction, 12 million square feet less than at the beginning of the year. Year-to-date, 48.3 million square feet of new office space started construction, as opposed to 58.9 million square feet last year and 86 million square feet in 2019.
Download and read the full report on November 2021 office lease rates, sales and construction here.


